Last reviewed against official Google Play Console and Android Developers documentation. Play Console labels can change; confirm in your console and on the linked pages.
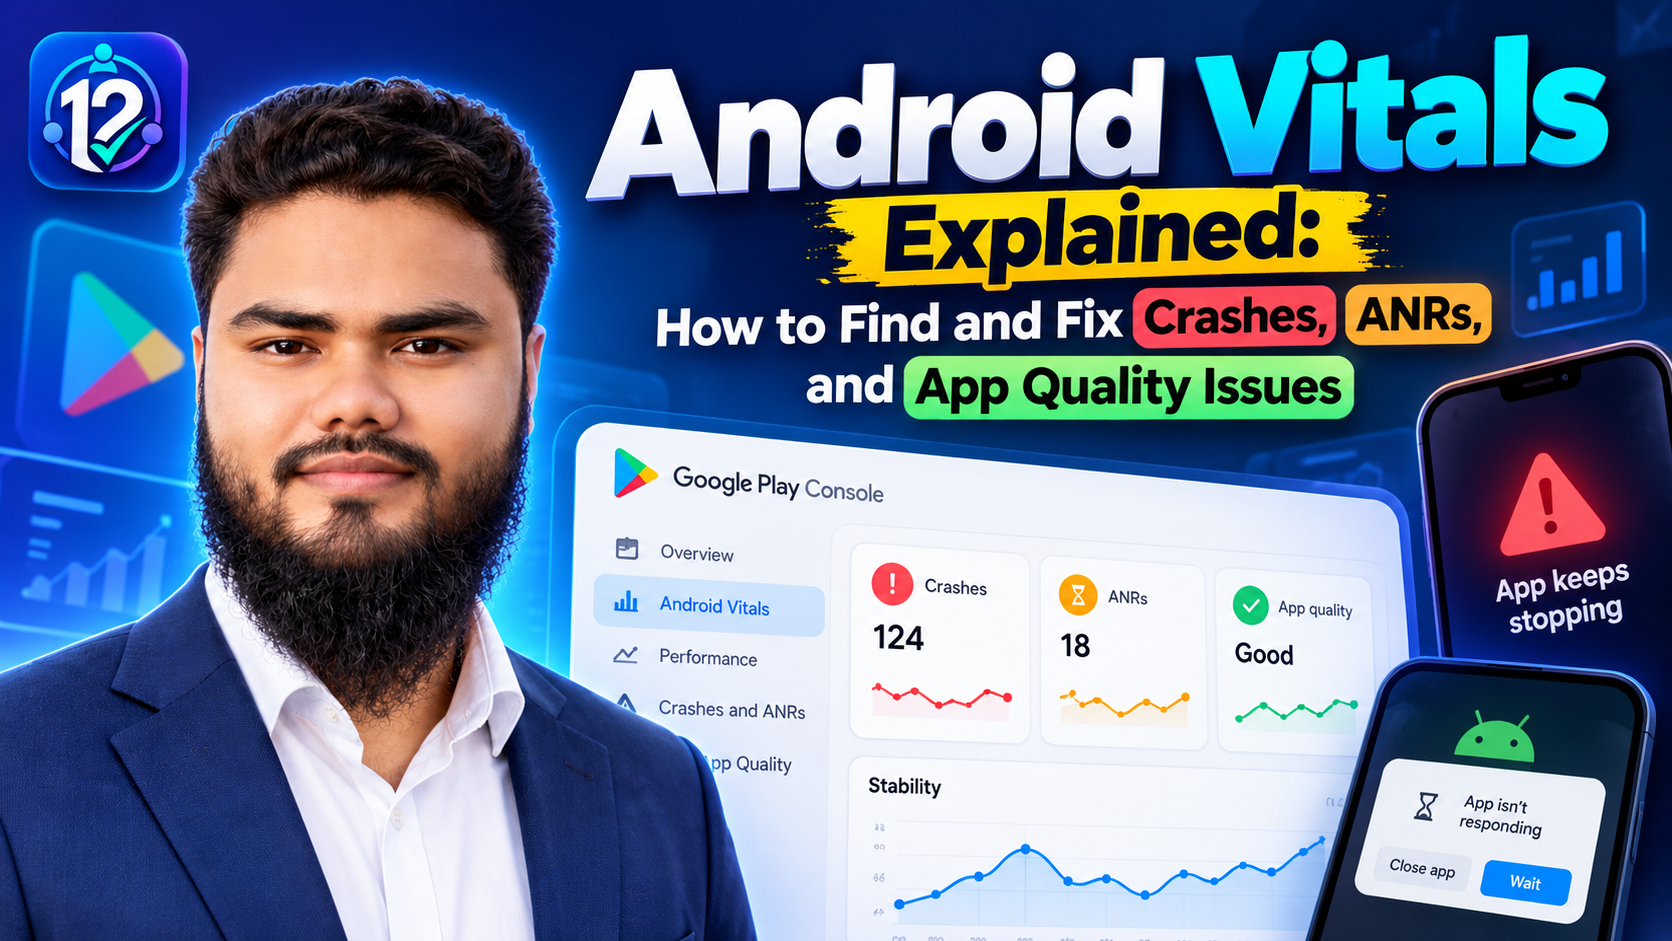
Android Vitals is Google Play Console's technical-quality dashboard. It shows how your app behaves on real users' devices, including the user-perceived crash and ANR rates — the failures users actually notice.
This guide covers the work behind those numbers: finding the issue, reading the evidence, reproducing it, fixing the cause, and checking the fix.
Quick answer: what Android Vitals does, and what it cannot do
The short version
- Find it under Monitor and improve > Android vitals. Overview shows core vitals; Crashes and ANRs shows clusters and evidence.
- A crash is an unexpected exit from an unhandled exception or signal. An ANR happens when the main thread is blocked too long.
- User-perceived rates count failures users notice. Google's overall thresholds are 1.09% for crashes and 0.47% for ANRs, with per-device thresholds.
- Vitals tells you where to look, not why. The trace and your reproduction still do the diagnostic work.
What Android Vitals is, and where to find it
Android Vitals is Google Play's technical-quality reporting system. Data comes from opted-in users on certified devices, for versions installed through Google Play. Play Console keeps 90 days; the Reporting API goes back three years. A sparse report is not proof that nothing is wrong.
Use two screens:
- Android vitals overview — Monitor and improve > Android vitals > Overview. Core vitals, "Critical issues", and metric breakdowns.
- Crashes and ANRs — Monitor and improve > Android vitals > Crashes and ANRs. Clusters, filters, and issue details.
The Overview separates bad behaviors (a metric over its threshold) from anomalies (a significant change, such as a sharp ANR-rate rise). Google notes that notifications are currently available for anomalies, not bad behaviors, so a quiet threshold breach may not email you.
Vitals does not explain the cause or give reliable reproduction steps, and it does not measure every user or install. It also does not decide publishing approval.
Crashes, ANRs, and other quality problems
An app crashes when it exits unexpectedly from an unhandled exception or signal: usually an unhandled Throwable in Java or Kotlin, or a signal such as SIGSEGV in native code. A crash can happen in a background component even when the user is not using the app.
An ANR — "Application Not Responding" — happens when the main thread is blocked for too long. The main thread updates the UI and handles input, so when it stalls, the app cannot draw or respond.
| Signal | What happens | What the user sees | Typical evidence | First question |
|---|---|---|---|---|
| Crash | Process exits from an unhandled exception or signal. | "App has stopped", or the app disappears. | Exception, stack trace, device, Android version, app version. | Which frame in your code is closest to the failure? |
| ANR | Main thread blocked; no input processing or drawing. | "App isn't responding" with Wait and Close. | ANR type, activity name, main-thread trace, lock/binder state. | What was the main thread waiting for? |
| Other quality issue | Startup, rendering, frozen frames, low-memory kill, battery, permissions. | Jank, lag, or unexpected behaviour rather than a visible failure. | Metric charts and breakdowns, not a crash cluster. | Is this stability, performance, or product? |
What user-perceived crash and ANR rates measure
Both rates are normalized by daily active users (one day, one device; one person on two devices counts twice). User-perceived means the failure was likely noticed: a crash while displaying an activity or running a foreground service, or an ANR from "input dispatching timed out". These rates exclude failures users probably did not see.
Each metric has an overall and a per-device version. The overall rate averages across devices; a per-device rate covers one device model. Both can breach independently, so a healthy overall number can hide a problem on one phone model.
| Metric | What it counts | Overall threshold | Per phone model threshold |
|---|---|---|---|
| User-perceived crash rate | Percentage of daily users with at least one user-perceived crash. | 1.09% | 8% |
| User-perceived ANR rate | Percentage of daily users with at least one user-perceived ANR. | 0.47% | 8% |
These are the current values for apps on phones; Google's full table also lists watch values. Play generally considers 28 days, but may act sooner after a spike. Exceeding a threshold may reduce visibility and add a store-listing warning. It is not a production-access criterion; the 12-tester, 14-day requirement and the production-access review are separate. See how the 12-tester and 14-day requirement works. Source: Android vitals thresholds.
Small samples are noisy: a handful of crashes can move a daily percentage sharply, and a low-volume device model can dominate a per-device rate. Check affected-user counts and the trend.
A practical Android Vitals troubleshooting workflow
The workflow below is a practical recommendation, not a Google requirement. It is designed to stop two common mistakes: changing code before reading the evidence, and calling a fix successful before the affected conditions have been retested.
- Start with the metric and cluster. Filter Crashes and ANRs to user-perceived issues and sort by affected users. Check Artifact, Android version (SDK), form factor, device model, and country/region. One app version narrows the regression window; one device model or OS version suggests a platform or OEM interaction.
- Read the evidence. Open View details: stack trace, device and Android version, occurrence count, and any pre-launch report section with Logcat and video. Missing evidence is not proof that an issue is minor. If the cluster is marked possibly SDK-related, check your inputs, then the library and provider notes.
- Reproduce under the report's conditions. Match the app version, Android version, and device model. Use a low-RAM device for memory pressure, throttle the network for network errors, and test the right form factor. If a crash will not reproduce, narrow the call path with the trace, add targeted logging, and test the hypothesis.
- Fix the cause. Avoid silent null checks and screen-wide try/catch. Validate input, make nullable paths safe, move blocking work off the main thread, release resources, or update the failing dependency. Fix assumptions in the model or navigation flow, not just the crash site.
- Retest and release. Retest on the same device, Android version, app version, and state; run a regression pass on sign-in and the affected screen. Then ship through an appropriate track, use staged rollout where available, and watch the cluster after users receive the update.
- Monitor the trend. The 28-day average lags. If the rate does not move, check update adoption, whether the cluster persists on the new version, and whether a second cause is hiding. See how app updates work in closed testing.
How to read a crash report
A crash report is built around a stack trace: a snapshot of the nested calls that led to the failure. The exception type tells you what failed; the first frame in your code tells you where to start reading.
Illustrative example, not a real report:
FATAL EXCEPTION: main
Process: com.example.app, PID: 12345
java.lang.NullPointerException: Attempt to invoke virtual method
'java.lang.String com.example.app.model.User.getName()' on a null object reference
    at com.example.app.profile.ProfileFragment.render(ProfileFragment.kt:84)
    at com.example.app.profile.ProfileFragment.onViewCreated(ProfileFragment.kt:52)
    at androidx.fragment.app.Fragment.performViewCreated(Fragment.java:3103)
Read from the top down. The exception is a null dereference. The first app frame is ProfileFragment.render at line 84. The useful question is not "why is the user null?" in the abstract, but "which path allowed this screen to render before the user object was available?" That usually leads to a loading-state, navigation, or data-layer fix.
Upload the R8/ProGuard mapping file and native debug symbols for each app version; app bundles with Android Gradle plugin 4.1 and later can include symbols automatically. Deobfuscation only affects crashes after upload. See deobfuscating crash stack traces and native debug symbols.
Common patterns, illustrative: null or missing state, invalid arguments, memory pressure, unhandled network or I/O errors, native signals, concurrency, SDK failures, and background components. The trace should decide where you look first.
How to diagnose an ANR
An ANR is a responsiveness failure, not an exception. Google documents triggers including input dispatching not completing within 5 seconds, a service or broadcast receiver exceeding its budget, a foreground service not calling startForeground within 5 seconds, and a JobService not returning in time.
Find the main thread in the trace. Common patterns are slow I/O, long calculations, a synchronous binder call, waiting on a lock held by a long operation, or a deadlock. Illustrative fragment, not a real report:
"main" prio=5 tid=1 Blocked
  at com.example.app.data.UserRepository.loadSync(UserRepository.kt:57)
  - waiting to lock <0x0a1b2c3d> held by thread 12
  at com.example.app.profile.ProfileViewModel.init(ProfileViewModel.kt:31)
  at com.example.app.profile.ProfileFragment.onViewCreated(ProfileFragment.kt:44)
The main thread is Blocked on a lock. The fix is not "make the lock faster"; understand why a synchronous load is on the main thread and why the lock is held that long. Moving the load to a background dispatcher may remove the ANR, but the shared-state design still needs review.
Tools: Play Console ANR details; /data/anr/anr_* traces via adb or a bug report; ApplicationExitInfo on Android 11+; StrictMode; and the Profiler or Layout Inspector. Background broadcast ANR dialogs appear only if Show all ANRs is enabled, so a background ANR can exist without a visible dialog.
Common causes, illustrative: main-thread I/O, large collection processing during composition, synchronous binder calls, lock contention or deadlock, heavy recomposition, and long work in receivers, services, or jobs. Move work to a background dispatcher or repository, use WorkManager for deferrable work, and keep composables cheap.
How to prioritize fixes
Google's guidance is direct: to improve app quality overall, fix the crashes and ANRs affecting the most users. For quality on specific devices, fix the biggest clusters on those devices. If you have both, start with the largest overall clusters. That is a better default than starting with the most dramatic stack trace.
Weigh these factors together:
- User-perceived or not. A failure the user noticed is more urgent than a background failure with the same count.
- Affected users and per-device concentration. A small cluster above the per-device threshold can still cost users on that model.
- Critical journey. A crash on launch, sign-in, checkout, or the core task matters more than a rarely used settings screen.
- Reproducibility, regression risk, and dependency ownership. A clear bug is a better investment than a mysterious intermittent crash; a shared data-layer fix needs more testing; an SDK fix may depend on the provider.
Do not chase a perfect rate on a three-user device model while a large overall cluster is open.
How manual testing, tester feedback, and pre-launch reports fit in
Vitals is post-release, sampled, anonymous, and short on context. Three sources close the gap.
Pre-launch report. An automated test of an uploaded bundle or production release on test devices, subject to capacity. It covers stability, compatibility, performance and accessibility, and can catch issues before users do. Its crashes do not affect production crash statistics. See the pre-launch report guide.
Manual testing. Covers critical journeys, account states, networks, and the devices users actually have. Build a matrix from analytics and Vitals breakdowns. See compatibility testing.
Tester feedback. Adds the "what were you doing?" context. Ask for device, Android version, app version, steps, and a screenshot or recording; see the closed-testing feedback guide. It is often the fastest route to a reproduction.
A clean pre-launch report is not a clean Vitals dashboard: samples and eligibility differ, so one does not cancel the other.
Pre-release and post-release checklist
Before release
- Crash reporting starts early enough to catch startup failures.
- Mapping and native debug symbols are generated and uploaded for the release.
- StrictMode is enabled in debug builds; critical journeys are tested on low-memory and affected Android versions.
- The pre-launch report is reviewed when generated.
After release
- Check Overview for critical issues and anomalies.
- Open Crashes and ANRs, filter to user-perceived issues, and sort by affected users.
- Read the trace and check app version, Android version, device model, and form factor before changing code.
- Reproduce where possible, retest, run a regression pass, then release and watch the 28-day trend.
Frequently asked questions
What is a good user-perceived crash rate?
The overall bad-behavior threshold is 1.09%; the per-phone-model threshold is 8%. Treat these as ceilings, not targets.
What is the difference between a crash and an ANR?
A crash is an unexpected process exit from an unhandled exception or signal. An ANR happens when the main thread is blocked too long, so the app cannot process input or draw.
Why can't I reproduce a crash that Android Vitals reports?
It may depend on memory, network, account state, a screen sequence, or an OEM behaviour. Use the trace to narrow the path, match the affected device and version, and add targeted logging. Some crashes are genuinely not reproducible.
Does fixing a crash update the rate immediately?
No. Google generally considers the last 28 days, and a fix only affects data after users receive the update. Check the occurrence pattern and affected-user count, not just the percentage.
Do Android Vitals thresholds affect production access?
They are technical-quality and discoverability signals. Threshold breaches can reduce visibility and add a store-listing warning. Closed testing and production access are separate processes; a clean dashboard is not a guarantee of approval.
Official sources and further reading
- Android vitals: core vitals and bad-behavior thresholds
- Monitor your app's technical quality with Android vitals
- View crashes and application not responding errors
- Diagnose and fix crashes
- Diagnose and fix ANRs
- Technical quality requirements
Conclusion: make the trend better, not just the number
Android Vitals is most useful as a diagnostic starting point. Find the cluster that affects the most users, read the evidence, reproduce on the right device and version, fix the cause, retest, and give the fix time to show up in the 28-day window. The number will lag the work.
Vitals is a post-release signal, not a pre-release test suite, a policy review, or a guarantee of production access. Pair it with the pre-launch report, manual testing, and tester feedback. If you need real testers, 12 Testers Community provides that service; it does not replace the diagnostic work in this guide.